- Version
- Download 27
- File Size 1,712.02 MB
- File Count 1
- Create Date 2019-06-06
- Last Updated 2019-06-14
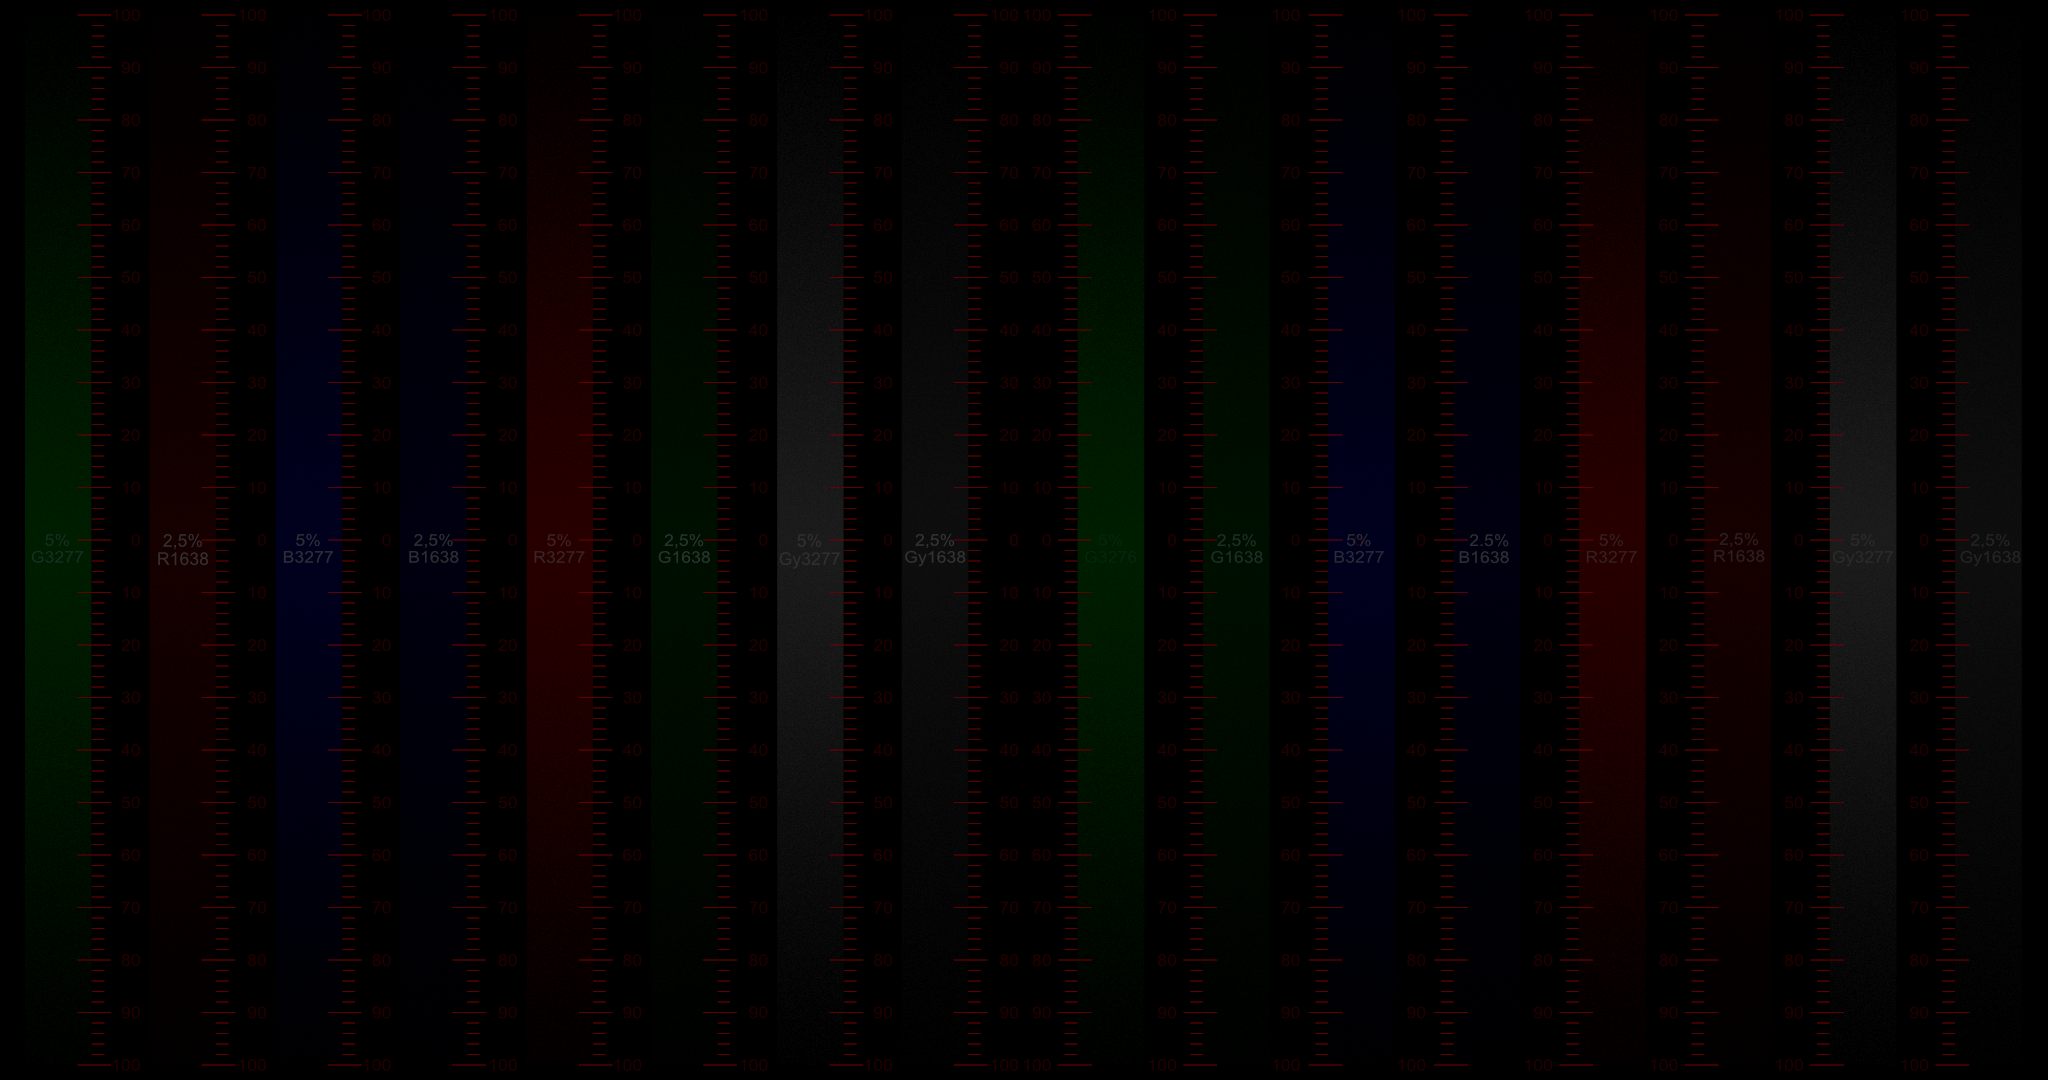
This DCP is a minute or so of the TIFF files presented at: Vertical Meters TIFF
The Passcode, as always, is: QA_b4_QC
This is the 2nd of 3 attempts to find a way that a non-technical person can look at a screen and tell whether their system is stable or has changed for the worse since the last evaluation.
There are 3 slides with different combinations of meters. The first is 5 and 2.5 of each color and Grey, duplicated on the right side a little different than on the left. The 2nd is 2.5% and 1%. The third shows 1 and point 1.
Can a P3 projection system in a room with a lot of stray light even get a good reading with 5% bars? ...and will it be too easy for a sophisticated room...and will Point One be seen on a 1,000,000:1 screen?
We would like to get feedback on what combination of different percentages for different colors would be best, and if you notice, which order...for example, should the grays be on the outside? ...or the greens never near the blues?
Thanks~!
